You may continue to use the historical monitoring, SingleStore’s former monitoring solution, if you are currently unable to migrate to SingleStore’s native monitoring solution.
Please note that historical monitoring has been deprecated in favor of SingleStore’s native monitoring solution and may no longer function in future versions of SingleStore DB.
Select the option that best meets your needs:
-
Option 1: You’re currently not using a SingleStore monitoring solution.
-
Option 2: You’re using historical monitoring, have upgraded to SingleStore DB 7.1.8 or later, and prefer to migrate to the new monitoring solution.
Configure the metrics Database
The metrics database can either reside in the Source cluster, in a dedicated Metrics cluster, or in a remote cluster that the Metrics cluster can access.
Note that the user that creates the metrics database may differ from the one that started the exporter. This user must have the ability to create tables, databases, and pipelines. At minimum, it requires the following permissions:
SingleStore DB Toolbox
The following command creates a database named metrics with a 10-day retention period for the data, and will also create the associated metrics and blobs pipelines. These pipelines are responsible for extracting data from the exporter and storing it in the metrics database.
The exporter-host value must be the Master Aggregator host in the Source cluster. The user and password are the credentials for the Metrics cluster. The variable retention-period defines the number of days that data is retained before being deleted. Refer to sdb-admin start-monitoring for more information.
Please note the following:
-
The database that is created to store monitoring data is named
metricsby default. You may change the database name by updating the value of the--database-nameoption. -
The database user is
rootby default. When creating themetricsdatabase with a database user other thanroot, theSUPERprivilege must be granted to this user. For example, for adbmonuser:GRANT SUPER ON *.* TO 'dbmon'@'%'; -
The IP address provided in the
exporter-hostargument must be resolvable by all hosts in the cluster. If the cluster you are monitoring has hosts that contain leaf nodes (as is common in a multi-host vs. single-host deployment), do not uselocalhost. Instead, provide the explicit IP address or hostname that the other hosts in the cluster can resolve. -
This command must be run on the Metrics cluster.
sdb-admin start-monitoring \
--database-name metrics \
--exporter-host <exporter-hostname-or-IP-address> \
--user root \
--password <secure-password> \
--retention-period 10
For Metrics clusters running SingleStore DB 7.3.12 and earlier that are managed by Toolbox 1.11.7 and earlier, when a new Source cluster is monitored, the specified --retention-period will apply to all existing Source clusters.
For Metrics clusters running SingleStore DB 7.3.13 and later that are managed with Toolbox 1.11.8 and later, a unique --retention-period can be specified for each Source cluster. Therefore, when a new Source cluster is monitored, the specified --retention-period will only apply to that Source cluster.
SQL
Alternatively, you may run the following scripts to configure the database.
Please note the following:
-
The database that is created to store monitoring data is named
metricsby default. You must edit these SQL statements manually to change the database name. -
The database user is
rootby default. When creating themetricsdatabase with a database user other thanroot, theSUPERprivilege must be granted to this user. For example, for adbmonuser:GRANT SUPER ON *.* TO 'dbmon'@'%'; -
These commands must be run on the Master Aggregator of the Metrics cluster.
Create the metrics database and associated tables by copying, pasting, and executing each set of SQL statements below. This can be done via the SQL Editor in SingleStore DB Studio, or your favored SQL client.
These SQL statements are also available in a downloadable metrics-database-ddl.zip file from SingleStore DB.
create database if not exists metrics;

use metrics;

CREATE TABLE IF NOT EXISTS `metrics` (
    `labels`                                          JSON,
    `name`                                            TINYBLOB NOT NULL,
    `memsql_tags`                                            JSON COLLATE utf8_bin,
    `cluster` AS `memsql_tags`::$cluster                     PERSISTED TINYBLOB,
    `host` AS `labels`::$host                           PERSISTED TINYBLOB,
    `port` as `labels`::$port                           PERSISTED SMALLINT(6),
    `role` as `labels`::$role                           PERSISTED TINYBLOB,
    `extractor` as substring_index(`name`, '_', 1)    PERSISTED TINYBLOB,
    `subsystem` as substring_index(substring_index(`name`, '_', 2), '_', -1) PERSISTED TINYBLOB,
    `job` AS `memsql_tags`::$push_job                        PERSISTED TINYBLOB,
    `value`                                           DOUBLE NOT NULL,
    `intval` AS floor(`value`)                        PERSISTED BIGINT(20),
    `time_sec`                                        BIGINT(20) NOT NULL,
    KEY `name` (`cluster`,`extractor`,`subsystem`,`host`,`role`,`name`,`time_sec`) USING CLUSTERED COLUMNSTORE,
    SHARD KEY()
);

CREATE TABLE IF NOT EXISTS act_samples (
    `cluster` varchar(512) CHARACTER SET utf8 COLLATE utf8_bin NOT NULL,
    `memsql_tags` JSON NOT NULL,
    `ts` timestamp NOT NULL DEFAULT CURRENT_TIMESTAMP,
    `ACTIVITY_TYPE` varchar(512) CHARACTER SET utf8 COLLATE utf8_bin NOT NULL,
    `ACTIVITY_NAME` varchar(512) CHARACTER SET utf8 COLLATE utf8_bin NOT NULL,
    `DATABASE_NAME` varchar(512) CHARACTER SET utf8 COLLATE utf8_bin DEFAULT NULL,
    `CPU_TIME_MS` bigint(4) DEFAULT NULL,
    `CPU_WAIT_TIME_MS` bigint(4) DEFAULT NULL,
    `ELAPSED_TIME_MS` bigint(4) DEFAULT NULL,
    `LOCK_TIME_MS` bigint(4)  DEFAULT NULL,
    `NETWORK_TIME_MS` bigint(4)  DEFAULT NULL,
    `DISK_TIME_MS` bigint(4) DEFAULT NULL,
    `DISK_B` bigint(4) DEFAULT NULL,
    `NETWORK_B` bigint(4) DEFAULT NULL,
    `MEMORY_BS` bigint(4) DEFAULT NULL,
    `MEMORY_MAJOR_FAULTS` bigint(4) DEFAULT NULL,
    `RUN_COUNT` bigint(4)  NULL DEFAULT '0',
    `SUCCESS_COUNT` bigint(4)  NULL DEFAULT '0',
    `FAILURE_COUNT` bigint(4)  NULL DEFAULT '0',
    KEY (`cluster`, `ACTIVITY_TYPE`,`ACTIVITY_NAME`,`DATABASE_NAME`, ts) USING CLUSTERED COLUMNSTORE,
    SHARD KEY()
);

create table IF NOT EXISTS mv_queries
(
    `cluster` varchar(512) NOT NULL,
    `memsql_tags` JSON NOT NULL,
    `ts` timestamp NOT NULL DEFAULT CURRENT_TIMESTAMP ON UPDATE CURRENT_TIMESTAMP,
    `ACTIVITY_NAME` varchar(512),
    `QUERY_TEXT` varchar(8192),
    `PLAN_WARNINGS` varchar(8192),
    KEY (`cluster`, `ACTIVITY_NAME`) USING CLUSTERED COLUMNSTORE,
    SHARD KEY()
);

create table IF NOT EXISTS cluster_info
(
    `cluster` varchar(512) NOT NULL,
    `memsql_tags` JSON NOT NULL,
    `ts` timestamp NOT NULL DEFAULT CURRENT_TIMESTAMP,
    `status` JSON NOT NULL,
    KEY (cluster, ts) USING CLUSTERED COLUMNSTORE,
    SHARD KEY()
);

create table IF NOT EXISTS db_status
(
    `memsql_tags` JSON NOT NULL,
    `keys` JSON NOT NULL,
    `values` JSON NOT NULL,
    `ts` timestamp NOT NULL DEFAULT CURRENT_TIMESTAMP,
    `cluster` AS `memsql_tags`::$cluster                 PERSISTED TINYBLOB,
    database_name AS `keys`::$database_name       PERSISTED TINYBLOB,
    `role` as `keys`::$role                       PERSISTED tinyblob,
    num_partitions as `values`::$num_partitions   PERSISTED SMALLINT(6),
    `online` as `values`::$online                 PERSISTED SMALLINT(6),
    `offline` as `values`::$offline               PERSISTED SMALLINT(6),
    replicating as `values`::$replicating         PERSISTED SMALLINT(6),
    recovering as `values`::$recovering           PERSISTED SMALLINT(6),
    pending as `values`::$pending                 PERSISTED SMALLINT(6),
    transition as `values`::$transition           PERSISTED SMALLINT(6),
    unrecoverable as `values`::$unrecoverable     PERSISTED SMALLINT(6),
    ref_db_state as `values`::$ref_db_state       PERSISTED TINYBLOB,
    summary as `values`::$summary                 PERSISTED TINYBLOB,
    KEY (cluster, database_name, ts) USING CLUSTERED COLUMNSTORE,
    SHARD KEY()
);

create table if not exists mv_events
(
    `memsql_tags` JSON NOT NULL,
    `keys` JSON NOT NULL,
    `values` JSON NOT NULL,
    ts TIMESTAMP NOT NULL DEFAULT CURRENT_TIMESTAMP,
    event_ts TIMESTAMP,
    `cluster` AS `memsql_tags`::$cluster                 PERSISTED TINYBLOB,
    `event_type` AS `keys`::$event_type           PERSISTED TINYBLOB,
    `origin_node_id` AS `keys`::$origin_node_id   PERSISTED SMALLINT,
    `ip_addr` AS `values`::$ip_addr               PERSISTED TINYBLOB,
    `port` AS `values`::$port                     PERSISTED SMALLINT,
    `type` AS `values`::$type                     PERSISTED TINYBLOB,
    `severity` as `keys`::$severity               PERSISTED TINYBLOB,
    `details` as `values`::$details               PERSISTED TINYBLOB,
    KEY (cluster, origin_node_id, event_ts) USING CLUSTERED COLUMNSTORE,
    SHARD KEY()
);

delimiter //
create or replace procedure purge_metrics() AS
begin
    delete from metrics where TIMESTAMPDIFF(MINUTE, FROM_UNIXTIME(time_sec), NOW()) > @@monitoring_retention_period;
end //
delimiter ;

delimiter //
create or replace procedure purge_blobs() AS
begin
    delete from act_samples where TIMESTAMPDIFF(MINUTE, ts, NOW()) > @@monitoring_retention_period;
    delete from mv_events where TIMESTAMPDIFF(MINUTE, ts, NOW()) > @@monitoring_retention_period;
    delete from mv_queries where TIMESTAMPDIFF(MINUTE, ts, NOW()) > @@monitoring_retention_period;
    delete from cluster_info where TIMESTAMPDIFF(MINUTE, ts, NOW()) > @@monitoring_retention_period;
    delete from db_status where TIMESTAMPDIFF(MINUTE, ts, NOW()) > @@monitoring_retention_period;
end //
delimiter ;

delimiter //
CREATE or replace PROCEDURE load_metrics (metrics_pipe query(`labels` JSON, `name` TINYBLOB, `memsql_tags` JSON COLLATE utf8_bin,`value` DOUBLE NOT NULL,`time_sec` BIGINT(20) NOT NULL)) AS
BEGIN
    INSERT INTO metrics (
        `labels`,
        `name`,
        `memsql_tags`,
        `value`,
        `time_sec`
    ) SELECT
        `labels`,
        `name`,
        `memsql_tags`,
        `value`,
        `time_sec`
        from metrics_pipe;
    call purge_metrics();
END //
delimiter ;

delimiter //
create or replace procedure load_blobs (blobs_pipe query(type text, `keys` JSON, `vals` JSON, time_sec bigint, `memsql_tags` JSON NULL)) AS
begin
    insert into act_samples (
        `cluster`,
        `memsql_tags`,
        `ts`,
        `ACTIVITY_TYPE`,
        `ACTIVITY_NAME`,
        `DATABASE_NAME`,
        `CPU_TIME_MS`,
        `CPU_WAIT_TIME_MS`,
        `ELAPSED_TIME_MS`,
        `LOCK_TIME_MS` ,
        `NETWORK_TIME_MS` ,
        `DISK_TIME_MS`,
        `DISK_B`,
        `NETWORK_B`,
        `MEMORY_BS`,
        `MEMORY_MAJOR_FAULTS`,
        `RUN_COUNT`,
        `SUCCESS_COUNT`,
        `FAILURE_COUNT`
    ) select
    `memsql_tags`::$cluster,
    `memsql_tags`,
    FROM_UNIXTIME(time_sec),
    `keys`::$activity_type,
    `keys`::$activity_name,
    `keys`::$db_name,
    `vals`::cpu_time_ms,
    `vals`::cpu_wait_time_ms,
    `vals`::elapsed_time_ms,
    `vals`::lock_time_ms,
    `vals`::network_time_ms,
    `vals`::disk_time_ms,
    `vals`::disk_b,
    `vals`::network_b,
    `vals`::memory_bs,
    `vals`::memory_major_faults,
    `vals`::run_count,
    `vals`::success_count,
    `vals`::failure_count
    from blobs_pipe
    where type = 'activity';
    insert into mv_events (
        `memsql_tags`,
        `keys`,
        `values`,
        `ts`,
        `event_ts`
    )
    select
    `memsql_tags`,
    `keys`,
    `vals`,
    FROM_UNIXTIME(time_sec),
    FROM_UNIXTIME(`keys`::$event_time)
    from blobs_pipe b
    left join (SELECT distinct cluster,
        origin_node_id,
        event_ts from mv_events) k
    ON b.`memsql_tags`::$cluster = k.cluster
    and b.`keys`::$origin_node_id = k.origin_node_id
    and b.`keys`::$event_time = k.event_ts
    where type = 'event'
    and k.cluster is null
    and k.origin_node_id is null;
    insert into mv_queries (
        `cluster`,
        `ACTIVITY_NAME`,
        `memsql_tags`,
        `ts`,
        `QUERY_TEXT`,
        `PLAN_WARNINGS`
    )
    select
    `memsql_tags`::$cluster,
    `keys`::$activity_name,
    `memsql_tags`,
    FROM_UNIXTIME(MAX(time_sec)),
    `vals`::$query_text,
    `vals`::$plan_warnings
    from blobs_pipe b
    left join (SELECT distinct cluster, ACTIVITY_NAME from mv_queries) k
    ON b.`memsql_tags`::$cluster = k.cluster and b.`keys`::$activity_name = k.ACTIVITY_NAME
    where type = 'query'
    and k.cluster is null and k.ACTIVITY_NAME is null
    group by 1, 2;
    insert into cluster_info (
        `cluster`,
        `memsql_tags`,
        `ts`,
        `status`
    ) select
    `memsql_tags`::$cluster,
    `memsql_tags`,
    FROM_UNIXTIME(time_sec),
    `vals`
    from blobs_pipe
    where type = 'cluster';
    insert into db_status (
        `memsql_tags`,
        `keys`,
        `values`,
        `ts`
    ) select
    `memsql_tags`, `keys`, `vals`, FROM_UNIXTIME(time_sec)
    from blobs_pipe
    where type = 'db_state';
    call purge_blobs();
end //
delimiter ;

-- For Grafana
delimiter //
CREATE OR REPLACE FUNCTION `trim_metric`(input varchar(512) CHARACTER SET utf8 COLLATE utf8_general_ci NULL, prefix varchar(255) CHARACTER SET utf8 COLLATE utf8_general_ci NULL) RETURNS varchar(512) CHARACTER SET utf8 COLLATE utf8_general_ci NULL AS begin
  return
  CASE
  WHEN input is not null and prefix is not null and locate(prefix, input, 1) > 0 THEN
    UPPER(substr(input, locate(prefix, input, 1) + length(prefix), length(input) - length(prefix)))
  ELSE input end;
end //
delimiter ;

delimiter //
CREATE OR REPLACE FUNCTION `trim_host`(input varchar(512) CHARACTER SET utf8 COLLATE utf8_general_ci NULL, c int default 1) RETURNS varchar(512) CHARACTER SET utf8 COLLATE utf8_general_ci NULL AS begin
 return
 CASE
 WHEN input RLIKE '([[:digit:]]{1,3}\\.){3}[[:digit:]]{1,3}' THEN
  input
 ELSE substring_index(input, '.', c) end;
end //
delimiter ;

-- Helper table for integers 1..100
create reference table if not exists ints
(
    f int key
);
insert into ints values
(1), (2), (3), (4), (5), (6), (7), (8), (9), (10),
(11), (12), (13), (14), (15), (16), (17), (18), (19), (20),
(21), (22), (23), (24), (25), (26), (27), (28), (29), (30),
(31), (32), (33), (34), (35), (36), (37), (38), (39), (40),
(41), (42), (43), (44), (45), (46), (47), (48), (49), (50),
(51), (52), (53), (54), (55), (56), (57), (58), (59), (60),
(61), (62), (63), (64), (65), (66), (67), (68), (69), (70),
(71), (72), (73), (74), (75), (76), (77), (78), (79), (80),
(81), (82), (83), (84), (85), (86), (87), (88), (89), (90),
(91), (92), (93), (94), (95), (96), (97), (98), (99), (100);
End: Show metrics database DDL
Run the following in the SQL Editor in SingleStore DB Studio, or your favored SQL client.
Note: You must edit endpoint-url and port in the following SQL statements to align with where your exporter process resides.
- The
endpoint-urlis typically the host of your Source cluster’s Master Aggregator that’s running the exporter, and must includehttp://. - The default port for the endpoint is
9104.
Note: The endpoint-url provided in the pipeline statement must be resolvable by all hosts in the cluster. If the cluster you are monitoring has hosts that contain leaf nodes (as is common in a multi-host vs. single-host deployment), do not use localhost. Instead, provide the explicit IP address or hostname that the other hosts in the cluster can resolve.
The metrics pipeline:
create or replace pipeline `metrics` as
load data prometheus_exporter
"<endpoint-url:port>/cluster-metrics"
config '{"is_memsql_internal":true}'
into procedure `load_metrics` format json;
start pipeline if not running metrics;
The blobs pipeline:
create or replace pipeline `blobs` as
load data prometheus_exporter
"<endpoint-url:port>/samples"
config '{"is_memsql_internal":true,
"download_type":"samples"}'
into procedure `load_blobs` format json;
start pipeline if not running blobs;
End: Show pipelines DDLs
How to Stop the Monitoring Process
You may stop the monitoring process at any time by performing either of the following commands.
Note: Be sure to substitute the database name and/or the associated database user if you’ve changed them from the defaults of the metrics database and the root user.
SingleStore DB Toolbox
sdb-admin stop-monitoring \
--exporter-host <exporter-hostname-or-IP-address> \
--user root \
--password <secure-password>
SQL
You may manually stop the pipelines created earlier.
STOP PIPELINE metrics;
STOP PIPELINE samples;
Connect Data Visualization Tools
After configuring the metrics database, you can connect SingleStore Studio and data visualization tools such as Grafana to your cluster’s monitoring data. SingleStore Studio surfaces basic workload monitoring data, whereas Grafana provides additional dashboards for advanced analytics and troubleshooting.
As of SingleStore DB 7.3 and SingleStore Studio 3.1.0, your SingleStore Studio instance can be configured to surface specific monitoring data of your cluster. Learn how to connect Studio to your cluster’s monitoring data.
End: Configure and Connect SingleStore Studio
Note: If you already have Grafana installed, you may skip to Add the Grafana Monitoring Data Source.
Install Grafana
-
If a Grafana instance is not already available, install Grafana on the collecting Master Aggregator host.
-
Add the Grafana pie chart panel.
sudo grafana-cli plugins install grafana-piechart-panel -
Add the Grafana multi-bar graph panel.
sudo grafana-cli --pluginUrl https://github.com/CorpGlory/grafana-multibar-graph-panel/archive/0.2.5.zip plugins install multibar-graph-panel -
Restart the Grafana server.
sudo systemctl restart grafana-server
Add the Grafana Monitoring Data Source
For those SingleStore DB instances that don’t run database queries as root, this requires both admin privileges and SELECT and EXECUTE grants to the metrics database as per GRANT.
For example:
GRANT SELECT, EXECUTE ON metrics.* TO <user>@%;
where <user> is the user other than root under which these queries will be run.
-
Connect to Grafana at
http://<grafana-hostname>:3000and log in usingadminas the username andadminas the password. -
Add a ‘monitoring’ MySQL data source with the following settings. The SingleStore DB data source port is
3306by default.- Data source name:
monitoring - Data source type:
mysql - Data source host:
<metrics-cluster-master-aggregator-host> - Data source port:
3306 - Database name:
metrics - User:
root - Password:
<secure-password-or-blank-if-none>
- Data source name:
-
Alternatively, edit the
sample.yamlfile in the/etc/grafana/provisioning/datasourcesdirectory and add the following content, substituting the values in angle brackets with your SingleStore DB configuration.# # config file version apiVersion: 1 datasources: - name: monitoring type: mysql url: <metrics-cluster-master-aggregator-host>:<port> database: metrics user: root password: <secure-password-or-blank-if-none> isDefault: true version: 1 -
Restart the Grafana server.
sudo systemctl restart grafana-server
Connect Grafana Dashboards
You may need Editor privileges to create new Grafana dashboards.
-
Download the cluster monitoring dashboards from SingleStore DB.
-
Import the dashboards into Grafana. To import a dashboard, click the
+icon in the side menu, and then click Import. From here you can upload a dashboard JSON file, paste a Grafana.com dashboard URL, or paste dashboard JSON text directly into the text area. -
Alternatively, edit the
sample.yamlfile in the/etc/grafana/provisioning/dashboards/directory and add the following content.# # config file version apiVersion: 1 providers: - name: 'default' orgId: 1 folder: '' folderUid: '' type: file options: path: /var/lib/grafana/dashboardsNext, copy the dashboard JSON files to the
/var/lib/grafana/dashboardsdirectory and ensure that the dashboards are owned bygrafana:grafana(viachown grafana:grafana *). -
Restart the Grafana server.
sudo systemctl restart grafana-server
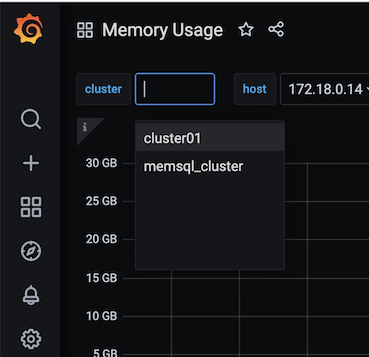
View Monitoring Data from Multiple Clusters (Optional)
You can view monitoring data from multiple source clusters in a single Grafana instance using the following steps:
-
Ensure that all cluster monitoring data is stored in a single database (on the
metricscluster). This will allow a single Grafana datasource to be configured. -
On each source cluster, enable the exporter processes.
-
On the
metricscluster, run start-monitoring for each source cluster and store the monitoring data in the same database. -
In the
metricsdatabase, update thecluster_namevariable with the name of each source cluster. (e.g.,set global cluster_name = 'cluster01'). This will allow Grafana to identify each cluster. -
Use the cluster tab in the Grafana UI to toggle between monitoring data from each source cluster.
End: Configure and Connect Grafana
End: Option 1: Monitor your cluster
Perform the following steps to migrate from historical monitoring to the new SingleStore monitoring solution.
As the core DDL has been updated, you must move your existing monitoring data into a new metrics database in order to migrate to the new monitoring solution.
The steps below will create the new DDL and move your existing monitoring data to this new database through a series of INSERT ... SELECT statements.
Note: You must create the new metrics database in the same cluster as your existing monitoring database.
- Run the
metricsdatabase DDL in the cluster that your existing monitoring data resides in. This can be done via the SQL Editor in SingleStore DB Studio, or your favored SQL client. This will create a new database in this cluster namedmetricswhich is where the new monitoring data will be stored.
These SQL statements are also available in a downloadable metrics-database-ddl.zip file from SingleStore DB.
create database if not exists metrics;

use metrics;

CREATE TABLE IF NOT EXISTS `metrics` (
    `labels`                                          JSON,
    `name`                                            TINYBLOB NOT NULL,
    `memsql_tags`                                            JSON COLLATE utf8_bin,
    `cluster` AS `memsql_tags`::$cluster                     PERSISTED TINYBLOB,
    `host` AS `labels`::$host                           PERSISTED TINYBLOB,
    `port` as `labels`::$port                           PERSISTED SMALLINT(6),
    `role` as `labels`::$role                           PERSISTED TINYBLOB,
    `extractor` as substring_index(`name`, '_', 1)    PERSISTED TINYBLOB,
    `subsystem` as substring_index(substring_index(`name`, '_', 2), '_', -1) PERSISTED TINYBLOB,
    `job` AS `memsql_tags`::$push_job                        PERSISTED TINYBLOB,
    `value`                                           DOUBLE NOT NULL,
    `intval` AS floor(`value`)                        PERSISTED BIGINT(20),
    `time_sec`                                        BIGINT(20) NOT NULL,
    KEY `name` (`cluster`,`extractor`,`subsystem`,`host`,`role`,`name`,`time_sec`) USING CLUSTERED COLUMNSTORE,
    SHARD KEY()
);

CREATE TABLE IF NOT EXISTS act_samples (
    `cluster` varchar(512) CHARACTER SET utf8 COLLATE utf8_bin NOT NULL,
    `memsql_tags` JSON NOT NULL,
    `ts` timestamp NOT NULL DEFAULT CURRENT_TIMESTAMP,
    `ACTIVITY_TYPE` varchar(512) CHARACTER SET utf8 COLLATE utf8_bin NOT NULL,
    `ACTIVITY_NAME` varchar(512) CHARACTER SET utf8 COLLATE utf8_bin NOT NULL,
    `DATABASE_NAME` varchar(512) CHARACTER SET utf8 COLLATE utf8_bin DEFAULT NULL,
    `CPU_TIME_MS` bigint(4) DEFAULT NULL,
    `CPU_WAIT_TIME_MS` bigint(4) DEFAULT NULL,
    `ELAPSED_TIME_MS` bigint(4) DEFAULT NULL,
    `LOCK_TIME_MS` bigint(4)  DEFAULT NULL,
    `NETWORK_TIME_MS` bigint(4)  DEFAULT NULL,
    `DISK_TIME_MS` bigint(4) DEFAULT NULL,
    `DISK_B` bigint(4) DEFAULT NULL,
    `NETWORK_B` bigint(4) DEFAULT NULL,
    `MEMORY_BS` bigint(4) DEFAULT NULL,
    `MEMORY_MAJOR_FAULTS` bigint(4) DEFAULT NULL,
    `RUN_COUNT` bigint(4)  NULL DEFAULT '0',
    `SUCCESS_COUNT` bigint(4)  NULL DEFAULT '0',
    `FAILURE_COUNT` bigint(4)  NULL DEFAULT '0',
    KEY (`cluster`, `ACTIVITY_TYPE`,`ACTIVITY_NAME`,`DATABASE_NAME`, ts) USING CLUSTERED COLUMNSTORE,
    SHARD KEY()
);

create table IF NOT EXISTS mv_queries
(
    `cluster` varchar(512) NOT NULL,
    `memsql_tags` JSON NOT NULL,
    `ts` timestamp NOT NULL DEFAULT CURRENT_TIMESTAMP ON UPDATE CURRENT_TIMESTAMP,
    `ACTIVITY_NAME` varchar(512),
    `QUERY_TEXT` varchar(8192),
    `PLAN_WARNINGS` varchar(8192),
    KEY (`cluster`, `ACTIVITY_NAME`) USING CLUSTERED COLUMNSTORE,
    SHARD KEY()
);

create table IF NOT EXISTS cluster_info
(
    `cluster` varchar(512) NOT NULL,
    `memsql_tags` JSON NOT NULL,
    `ts` timestamp NOT NULL DEFAULT CURRENT_TIMESTAMP,
    `status` JSON NOT NULL,
    KEY (cluster, ts) USING CLUSTERED COLUMNSTORE,
    SHARD KEY()
);

create table IF NOT EXISTS db_status
(
    `memsql_tags` JSON NOT NULL,
    `keys` JSON NOT NULL,
    `values` JSON NOT NULL,
    `ts` timestamp NOT NULL DEFAULT CURRENT_TIMESTAMP,
    `cluster` AS `memsql_tags`::$cluster                 PERSISTED TINYBLOB,
    database_name AS `keys`::$database_name       PERSISTED TINYBLOB,
    `role` as `keys`::$role                       PERSISTED tinyblob,
    num_partitions as `values`::$num_partitions   PERSISTED SMALLINT(6),
    `online` as `values`::$online                 PERSISTED SMALLINT(6),
    `offline` as `values`::$offline               PERSISTED SMALLINT(6),
    replicating as `values`::$replicating         PERSISTED SMALLINT(6),
    recovering as `values`::$recovering           PERSISTED SMALLINT(6),
    pending as `values`::$pending                 PERSISTED SMALLINT(6),
    transition as `values`::$transition           PERSISTED SMALLINT(6),
    unrecoverable as `values`::$unrecoverable     PERSISTED SMALLINT(6),
    ref_db_state as `values`::$ref_db_state       PERSISTED TINYBLOB,
    summary as `values`::$summary                 PERSISTED TINYBLOB,
    KEY (cluster, database_name, ts) USING CLUSTERED COLUMNSTORE,
    SHARD KEY()
);

create table if not exists mv_events
(
    `memsql_tags` JSON NOT NULL,
    `keys` JSON NOT NULL,
    `values` JSON NOT NULL,
    ts TIMESTAMP NOT NULL DEFAULT CURRENT_TIMESTAMP,
    event_ts TIMESTAMP,
    `cluster` AS `memsql_tags`::$cluster                 PERSISTED TINYBLOB,
    `event_type` AS `keys`::$event_type           PERSISTED TINYBLOB,
    `origin_node_id` AS `keys`::$origin_node_id   PERSISTED SMALLINT,
    `ip_addr` AS `values`::$ip_addr               PERSISTED TINYBLOB,
    `port` AS `values`::$port                     PERSISTED SMALLINT,
    `type` AS `values`::$type                     PERSISTED TINYBLOB,
    `severity` as `keys`::$severity               PERSISTED TINYBLOB,
    `details` as `values`::$details               PERSISTED TINYBLOB,
    KEY (cluster, origin_node_id, event_ts) USING CLUSTERED COLUMNSTORE,
    SHARD KEY()
);

delimiter //
create or replace procedure purge_metrics() AS
begin
    delete from metrics where TIMESTAMPDIFF(MINUTE, FROM_UNIXTIME(time_sec), NOW()) > @@monitoring_retention_period;
end //
delimiter ;
delimiter //
create or replace procedure purge_blobs() AS
begin
    delete from act_samples where TIMESTAMPDIFF(MINUTE, ts, NOW()) > @@monitoring_retention_period;
    delete from mv_events where TIMESTAMPDIFF(MINUTE, ts, NOW()) > @@monitoring_retention_period;
    delete from mv_queries where TIMESTAMPDIFF(MINUTE, ts, NOW()) > @@monitoring_retention_period;
    delete from cluster_info where TIMESTAMPDIFF(MINUTE, ts, NOW()) > @@monitoring_retention_period;
    delete from db_status where TIMESTAMPDIFF(MINUTE, ts, NOW()) > @@monitoring_retention_period;
end //
delimiter ;

delimiter //
CREATE or replace PROCEDURE load_metrics (metrics_pipe query(`labels` JSON, `name` TINYBLOB, `memsql_tags` JSON COLLATE utf8_bin,`value` DOUBLE NOT NULL,`time_sec` BIGINT(20) NOT NULL)) AS
BEGIN
    INSERT INTO metrics (
        `labels`,
        `name`,
        `memsql_tags`,
        `value`,
        `time_sec`
    ) SELECT
        `labels`,
        `name`,
        `memsql_tags`,
        `value`,
        `time_sec`
        from metrics_pipe;
    call purge_metrics();
END //
delimiter ;

delimiter //
create or replace procedure load_blobs (blobs_pipe query(type text, `keys` JSON, `vals` JSON, time_sec bigint, `memsql_tags` JSON NULL)) AS
begin
    insert into act_samples (
        `cluster`,
        `memsql_tags`,
        `ts`,
        `ACTIVITY_TYPE`,
        `ACTIVITY_NAME`,
        `DATABASE_NAME`,
        `CPU_TIME_MS`,
        `CPU_WAIT_TIME_MS`,
        `ELAPSED_TIME_MS`,
        `LOCK_TIME_MS` ,
        `NETWORK_TIME_MS` ,
        `DISK_TIME_MS`,
        `DISK_B`,
        `NETWORK_B`,
        `MEMORY_BS`,
        `MEMORY_MAJOR_FAULTS`,
        `RUN_COUNT`,
        `SUCCESS_COUNT`,
        `FAILURE_COUNT`
    ) select
    `memsql_tags`::$cluster,
    `memsql_tags`,
    FROM_UNIXTIME(time_sec),
    `keys`::$activity_type,
    `keys`::$activity_name,
    `keys`::$db_name,
    `vals`::cpu_time_ms,
    `vals`::cpu_wait_time_ms,
    `vals`::elapsed_time_ms,
    `vals`::lock_time_ms,
    `vals`::network_time_ms,
    `vals`::disk_time_ms,
    `vals`::disk_b,
    `vals`::network_b,
    `vals`::memory_bs,
    `vals`::memory_major_faults,
    `vals`::run_count,
    `vals`::success_count,
    `vals`::failure_count
    from blobs_pipe
    where type = 'activity';
    insert into mv_events (
        `memsql_tags`,
        `keys`,
        `values`,
        `ts`,
        `event_ts`
    )
    select
    `memsql_tags`,
    `keys`,
    `vals`,
    FROM_UNIXTIME(time_sec),
    FROM_UNIXTIME(`keys`::$event_time)
    from blobs_pipe b
    left join (SELECT distinct cluster,
        origin_node_id,
        event_ts from mv_events) k
    ON b.`memsql_tags`::$cluster = k.cluster
    and b.`keys`::$origin_node_id = k.origin_node_id
    and b.`keys`::$event_time = k.event_ts
    where type = 'event'
    and k.cluster is null
    and k.origin_node_id is null;
    insert into mv_queries (
        `cluster`,
        `ACTIVITY_NAME`,
        `memsql_tags`,
        `ts`,
        `QUERY_TEXT`,
        `PLAN_WARNINGS`
    )
    select
    `memsql_tags`::$cluster,
    `keys`::$activity_name,
    `memsql_tags`,
    FROM_UNIXTIME(MAX(time_sec)),
    `vals`::$query_text,
    `vals`::$plan_warnings
    from blobs_pipe b
    left join (SELECT distinct cluster, ACTIVITY_NAME from mv_queries) k
    ON b.`memsql_tags`::$cluster = k.cluster and b.`keys`::$activity_name = k.ACTIVITY_NAME
    where type = 'query'
    and k.cluster is null and k.ACTIVITY_NAME is null
    group by 1, 2;
    insert into cluster_info (
        `cluster`,
        `memsql_tags`,
        `ts`,
        `status`
    ) select
    `memsql_tags`::$cluster,
    `memsql_tags`,
    FROM_UNIXTIME(time_sec),
    `vals`
    from blobs_pipe
    where type = 'cluster';
    insert into db_status (
        `memsql_tags`,
        `keys`,
        `values`,
        `ts`
    ) select
    `memsql_tags`, `keys`, `vals`, FROM_UNIXTIME(time_sec)
    from blobs_pipe
    where type = 'db_state';
    call purge_blobs();
end //
delimiter ;

-- For Grafana
delimiter //
CREATE OR REPLACE FUNCTION `trim_metric`(input varchar(512) CHARACTER SET utf8 COLLATE utf8_general_ci NULL, prefix varchar(255) CHARACTER SET utf8 COLLATE utf8_general_ci NULL) RETURNS varchar(512) CHARACTER SET utf8 COLLATE utf8_general_ci NULL AS begin
  return
  CASE
  WHEN input is not null and prefix is not null and locate(prefix, input, 1) > 0 THEN
    UPPER(substr(input, locate(prefix, input, 1) + length(prefix), length(input) - length(prefix)))
  ELSE input end;
end //
delimiter ;

delimiter //
CREATE OR REPLACE FUNCTION `trim_host`(input varchar(512) CHARACTER SET utf8 COLLATE utf8_general_ci NULL, c int default 1) RETURNS varchar(512) CHARACTER SET utf8 COLLATE utf8_general_ci NULL AS begin
 return
 CASE
 WHEN input RLIKE '([[:digit:]]{1,3}\\.){3}[[:digit:]]{1,3}' THEN
  input
 ELSE substring_index(input, '.', c) end;
end //
delimiter ;

-- Helper table for integers 1..100
create reference table if not exists ints
(
    f int key
);
insert into ints values
(1), (2), (3), (4), (5), (6), (7), (8), (9), (10),
(11), (12), (13), (14), (15), (16), (17), (18), (19), (20),
(21), (22), (23), (24), (25), (26), (27), (28), (29), (30),
(31), (32), (33), (34), (35), (36), (37), (38), (39), (40),
(41), (42), (43), (44), (45), (46), (47), (48), (49), (50),
(51), (52), (53), (54), (55), (56), (57), (58), (59), (60),
(61), (62), (63), (64), (65), (66), (67), (68), (69), (70),
(71), (72), (73), (74), (75), (76), (77), (78), (79), (80),
(81), (82), (83), (84), (85), (86), (87), (88), (89), (90),
(91), (92), (93), (94), (95), (96), (97), (98), (99), (100);
End: Show new metrics database DDL
- Run the pipelines DDL in the cluster that your existing
monitoringdata resides in. This can be done via the SQL Editor in SingleStore DB Studio, or your favored SQL client. This will create new pipelines in this cluster namedmetricsandblobs.
Note: You must edit endpoint-url and port in the following SQL statements to align with where your exporter process resides.
- The
endpoint-urlis typically the host of your Source cluster’s Master Aggregator that’s running the exporter, and must includehttp://. - The default port for the endpoint is
9104.
Note: The endpoint-url provided in the pipeline statement must be resolvable by all hosts in the cluster. If the cluster you are monitoring has hosts that contain leaf nodes (as is common in a multi-host vs. single-host deployment), do not use localhost. Instead, provide the explicit IP address or hostname that the other hosts in the cluster can resolve.
The metrics pipeline:
create or replace pipeline `metrics` as
load data prometheus_exporter
"<endpoint-url:port>/cluster-metrics"
config '{"is_memsql_internal":true}'
into procedure `load_metrics` format json;
start pipeline if not running metrics;
The blobs pipeline:
create or replace pipeline `blobs` as
load data prometheus_exporter
"<endpoint-url:port>/samples"
config '{"is_memsql_internal":true, "download_type":"samples"}'
into procedure `load_blobs` format json;
start pipeline if not running blobs;
End: Show new pipelines DDLs
-
Run the migration DDL that will migrate your existing monitoring data into the new
metricsdatabase. This can be done via the SQL Editor in SingleStore DB Studio, or your favored SQL client.Note: This assumes that your existing monitoring database is named
monitoring. If it isn’t, you must update the corresponding aliases in the migration DDL.
INSERT into metrics.metrics (
    `labels`,
    `name`,
    `memsql_tags`,
    `value`,
    `time_sec`
)
select
    `tags`,
    `name`,
    CONCAT(
        "{",
        IFNULL(CONCAT('"cluster-name":', '"', `tags`::$`cluster-name`, '"', ","), ""),
        IFNULL(CONCAT('"push_job":', '"', `tags`::$push_job, '"'), ""),
        "}"
    ),
    `value`,
    `time_sec`
    from monitoring.metrics;

INSERT into metrics.act_samples select * from monitoring.act_samples;

INSERT into metrics.mv_queries select * from monitoring.mv_queries;

INSERT into metrics.cluster_info select * from monitoring.cluster_info;

INSERT into metrics.db_status (
    `memsql_tags`,
    `keys`,
    `values`,
    `ts`
) select
    `tags`,
    `keys`,
    `values`,
    `ts`
    from monitoring.db_status;

INSERT into metrics.mv_events (
    `memsql_tags`,
    `keys`,
    `values`,
    `ts`,
    `event_ts`
) select
    `tags`,
    `keys`,
    `values`,
    `ts`,
    `event_ts`
    from monitoring.mv_events;
End: Show migration DDL
-
Download the cluster monitoring dashboards from SingleStore DB.
-
Connect to Grafana at
http://<grafana-hostname>:3000and import the dashboards. To import a dashboard, click the+icon in the side menu, and then click Import. From here you can upload a dashboard JSON file, paste a Grafana.com dashboard URL, or paste dashboard JSON text directly into the text area. -
Update the database name to
metricsin your Grafana data source. -
Optional: Stop the SingleStore DB pusher process by running the following commands on your Source cluster’s Master Aggregator Host.
Obtain the SingleStore DB pusher process PID.
ps aux | grep memsql_pusherKill the SingleStore DB pusher process.
kill <PID> -
Optional: If you were using Kafka for historical monitoring only, you may decommission your Kafka instance.
End: Option 2: Migrate to the new monitoring solution

