You are viewing an older version of this section. View current production version.
Management View Statistics Reference
This topic describes the statistics columns present in the workload profiling management views.
As detailed in Management View Reference, each row of a given view profiles a particular set of tasks over a particular interval of time. The following generic column descriptions should be understood as the sum of the described statistic over all tasks in the set defined for a given view, as measured during the defined interval.
Extended Statistics
The statistics listed in the table below are present in the following management views found in the information_schema database:
mv_activities_extendedmv_activities_extended_cumulativemv_finished_tasksmv_tasks
| Column name | Description |
|---|---|
elapsed_time_ms |
Wall clock milliseconds elapsed during execution. This is likely to exceed the observed latency of a set of tasks because the tasks are likely to have executed concurrently. |
cpu_time_ms |
Milliseconds spent running on all the CPUs across the cluster. |
cpu_wait_time_ms |
Milliseconds spent waiting for a CPU to become available. A non-zero value indicates that there were more concurrent tasks in the workload than there were CPUs on which to run them. If this value is a significant fraction of elapsed time, the workload is likely issuing its queries faster than the hardware can handle. Investigate the tasks with the highest cpu_time_ms and optimize the relevant queries, reduce your workload, or provision more CPUs for your cluster. Note that this column is also an advanced statistic, and requires that the global variable read_advanced_counters is set to ON. |
disk_logical_read_b |
Bytes read from the filesystem. |
disk_logical_write_b |
Bytes written to the filesystem. |
disk_physical_read_b |
Bytes actually read from physical disk. This may be higher or lower than the logical number due to hardware and operating system artifacts and optimizations. Note that this column is also an advanced statistic, and requires that the global variable read_advanced_counters is set to ON. |
disk_physical_write_b |
Bytes actually written to physical disk. This may be higher or lower than the logical number due to hardware and operating system artifacts and optimizations. Note that this column is also an advanced statistic, and requires that the global variable read_advanced_counters is set to ON. |
disk_time_ms |
Milliseconds spent waiting for physical disk I/O to complete. If this value is high, it may indicate excessive time to commit transactions to storage. You may need hardware which supports a faster write rate, or you may need to investigate whether other processes are issuing too much I/O and introducing unwanted variability. Check which other activities are using disk_physical_read_b or disk_physical_write_b. Note that this column is also an advanced statistic, and requires that the global variable read_advanced_counters is set to ON. |
lock_row_time_ms |
Milliseconds spent waiting on table row locks. |
lock_time_ms |
Milliseconds spent waiting on locks and condition variables, excluding row locks. This isn’t solely wait time due to contention on data structures because it also includes some time spent waiting for events in general. |
log_flush_time_ms |
Milliseconds spent waiting for transaction log records to be flushed to disk. If this value is nonzero, it is usually indicative of disk issues. See disk_time_ms. |
log_buffer_time_ms |
Milliseconds spent waiting for space in the transaction log buffer. If this value is nonzero, it is usually indicative of disk issues. See disk_time_ms. |
log_buffer_b |
Bytes written to the transaction log buffer. These will eventually be flushed to disk by log flusher system tasks, whose disk_logical_write_b should include this quantity. |
memory_bs |
Byte-seconds of memory used. |
memory_major_faults |
Number of page faults which required disk I/O to resolve. Note that this column is also an advanced statistic, and requires that the global variable read_advanced_counters is set to ON. |
network_logical_recv_b |
Bytes received from a socket. |
network_logical_send_b |
Bytes written to a socket. |
network_time_ms |
Milliseconds spent waiting for sockets to be ready to send or receive data. This may indicate that leaves are slow to respond to a query, or that a distributed join involves a large data transfer. If this counter has a noticeable delay, check what other activities are consuming network_logical_recv_b and network_logical_send_b. |
Simplified Statistics
The statistics listed in the table below are present in the following management views in the information_schema database:
mv_activitiesmv_activities_cumulative
| Column name | Description |
|---|---|
elapsed_time_ms |
Wall clock milliseconds elapsed during execution. |
cpu_time_ms |
Milliseconds spent running on all the CPUs across the cluster. |
cpu_wait_time_ms |
Milliseconds spent waiting for a CPU to become available. A non-zero value indicates that there were more concurrent tasks in the workload than there were CPUs on which to run them. If this value is a significant fraction of elapsed time, the workload is likely issuing its queries faster than the hardware can handle. Investigate the tasks with the highest cpu_time_ms and optimize the relevant queries, reduce your workload, or provision more CPUs for your cluster. Note that this column is also an advanced statistic, and requires that the global variable read_advanced_counters is set to ON. |
disk_time_ms |
Milliseconds spent waiting for physical disk I/O to complete. If this value is high, it may indicate excessive time to commit transactions to storage. You may need hardware which supports a faster write rate, or you may need to investigate whether other processes are issuing too much I/O and introducing unwanted variability. Check which other activities are using disk_physical_read_b or disk_physical_write_b. Note that this column is also an advanced statistic, and requires that the global variable read_advanced_counters is set to ON. |
disk_b |
Number of bytes that SingleStore DB read and wrote to the filesystem or the in memory transaction log. |
lock_time_ms |
Milliseconds spent waiting on locks and condition variables, excluding row locks. This isn’t solely wait time due to contention on data structures because it also includes some time spent waiting for events in general. |
memory_bs |
Byte-seconds of memory used. |
network_b |
Number of bytes SingleStore DB sent and received to sockets. |
network_time_ms |
Milliseconds spent waiting for sockets to be ready to send or receive data. This may indicate that leaves are slow to respond to a query, or that a distributed join involves a large data transfer. If this counter has a noticeable delay, check what other activities are consuming network_logical_recv_b and network_logical_send_b. |
For simple statistics, elapsed_time_ms is aggregated over aggregators only, whereas all other statistics show total usage over both aggregators and leaves. For this reason, it is not meaningful to compare elapsed_time_ms to cpu_time_ms.
Statistics Availability
Some workload profiling statistic will be unavailable at certain times, on certain platforms.
Advanced Statistics
The following advanced statistics require operating system support to collect:
cpu_wait_time_msdisk_time_msdisk_physical_read_bdisk_physical_write_bmemory_major_faults
If SingleStore DB failed to collect an advanced statistic, the corresponding column in workload profiling views will contain NULL values and warnings will be returned by queries against the views.
In particular, cpu_wait_time_ms requires a Linux kernel compiled with CONFIG_SCHEDSTAT enabled. This flag is enabled by default on all Ubuntu and Red Hat Linux installations, but is omitted from certain versions of Debian Linux.
Advanced statistics are not collected by default in MemSQL 5.8. This is due to performance overhead of up to 10-40µS per query, equivalent to 5-10% overhead for the simple query select 1. We strongly recommend enabling advanced statistics, as they are critical to detecting disk, CPU, and memory saturation.
You may enable collection by setting the global variable read_advanced_counters to on on all nodes in the cluster. For more information on setting global variables, see the engine variables overview.
Understanding memory_bs
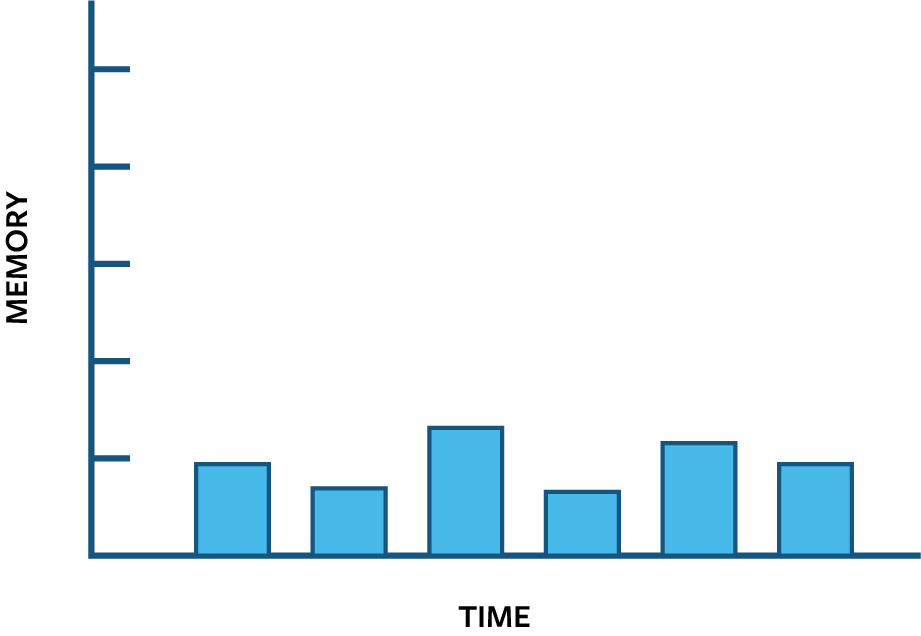
When reporting memory usage by activities, we report a metric that represents the memory requirements of that activity. To understand, we need to look at a chart of memory used by a connection over time.
In this chart of memory usage over a time, the connection runs many small short lived queries. While each query is running, it uses a small amount of memory:
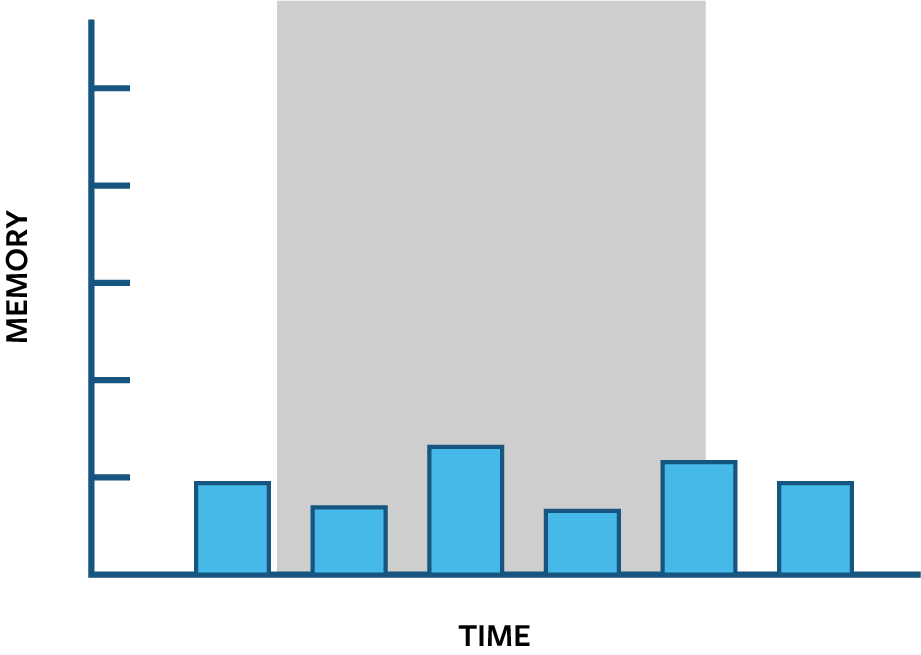
We want to report the memory used by these queries in an interval, for example during the grey interval:
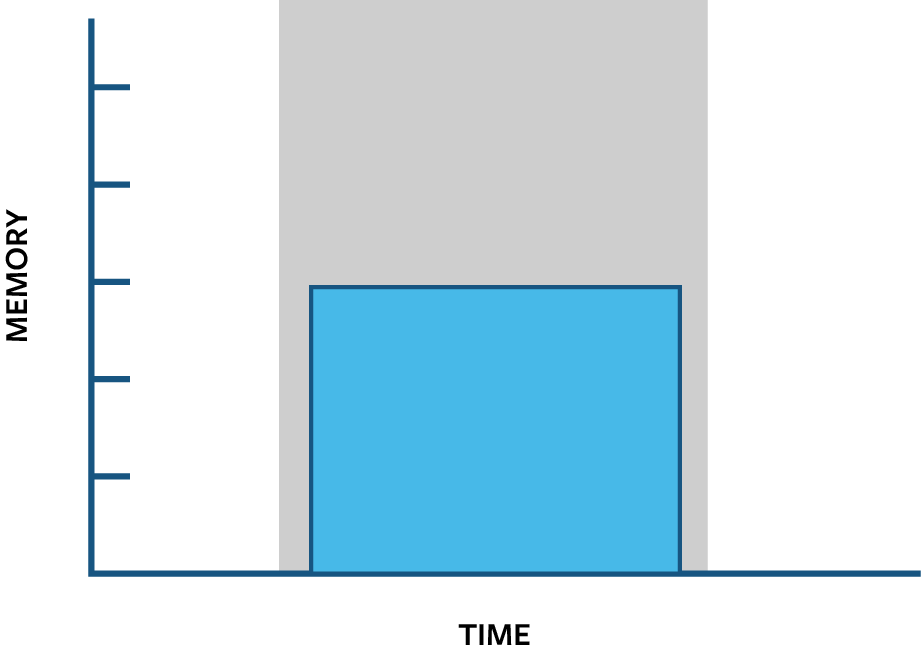
The following figure shows a different connection, with a single long running query that consumes a moderate amount of memory. During the grey interval, it reserves substantially more memory than the first connection of small short queries:
Here is a last connection, with a single expensive but short lived query that uses a large amount of memory. During the grey interval, it has a higher maximum amount of memory used; however, it is less costly to run:
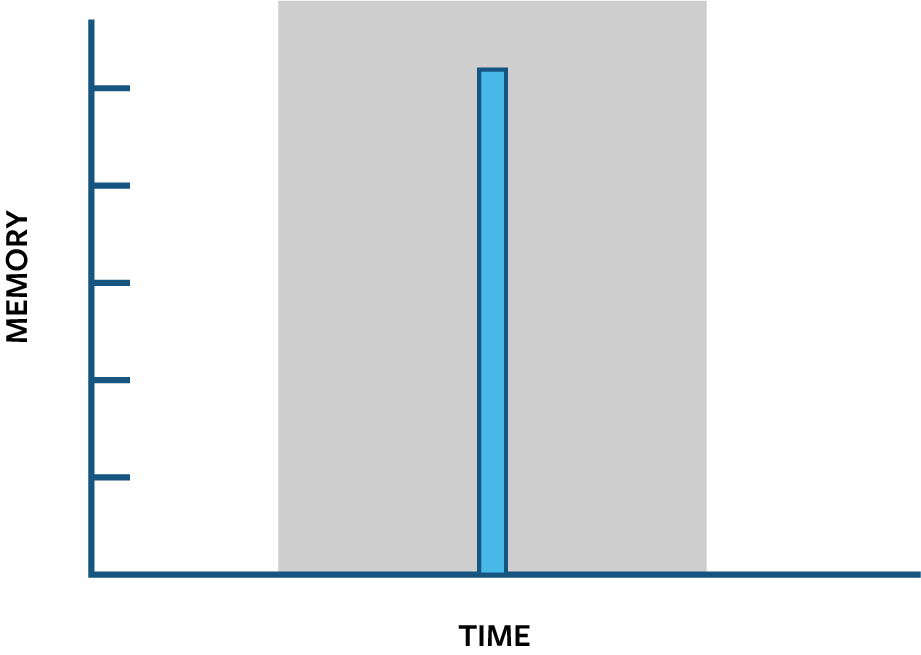
The last query is substantially less expensive than the previous query because it released its memory quickly. If the height of the chart is the maximum amount of memory available, the amount of the grey rectangle covered up by our blue queries represents how expensive the queries are. This area is measured in “byte seconds” and is calculated by multiplying the maximum memory used by a query by the elapsed time (i.e. the amount of time it held that memory and prevented other queries from using it).
Sample Query for memory_bs
To find the average memory used by a query, execute a query similar to the following:
memsql> use information_schema;
memsql> select 1000*memory_bs/elapsed_time_ms as avg_memory_used_b,
activity_name from mv_activities;
+-------------------+------------------------------------------------------------------+
| avg_memory_used_b | activity_name                                                    |
+-------------------+------------------------------------------------------------------+
|            0.0000 | registrationRunner                                               |
|            0.0000 | SlaveHandler_StreamFiles                                         |
|            0.0000 | ShardingPartition::WorkerThread                                  |
|        26192.8233 | ReadAndExecuteLoop                                               |
|            0.0000 | LogFlusherThreadFunc                                             |
|            0.0000 | SecondaryReplayThread::Run                                           |
|            0.0000 | LogFlusher                                                       |
|      1143400.0000 | Select_MV_ACTIVITIES_EXTENDED_CUMULATIVE__et_al_23409c29b9e1dd98 |                                        |
+-------------------+------------------------------------------------------------------+

