You are viewing an older version of this section. View current production version.
SingleStore DB Studio Visual Explain
The SingleStore DB (MemSQL) Visual Explain page is a feature of SingleStore DB Studio that allows customers to see a query plan visualized via a graphical interface. This is useful for tuning database queries in order to reduce run-time or resource usage. See more about this in the Query Tuning guide.
Using Visual Explain
To use Visual Explain, highlight the desired query in the SQL Editor and click the Visual Explain icon to the left of the Run button. The icon resembles a tree. After clicking, you may then choose between EXPLAIN and PROFILE.
At the top-left of the Visual Explain page, you may choose the Actual, Estimated, or Difference options for a given query plan.
At the center of this interface is a tree composed of clickable elements, where each element displayed is a single query plan operation. These are ordered so that the operator at the top of the tree is the one that returns the result to the client.
An alternative method for using Visual Explain is to click the Visual Explain icon in the left sidebar and upload a JSON file that contains a query plan.
Metrics Displayed by Visual Explain
Each element of the center graphic portion of this page includes the following information:
- The query plan operation being performed
- The percent of total query execution time for each query plan operation
- The number of rows processed by each query plan operation. This number could be greater than the number of rows in a given table if the query includes a command, such as a nested loop join, that requires the engine to read the table multiple times.
- The associated table each query plan operation is performed on (where applicable)
The following metrics are also shown as text on the right of the Visual Explain page. If no element of the graphic has been clicked, a summary of all query operations is shown. If a specific query operation has been selected, this section will show more detailed information.
- Summary
- Total execution time
- Total number of operations
- Total memory usage
- Details
- Each query plan operation
- Time spent on each query plan operation
Example
This example shows a simple use of Visual Explain to make a query run faster. First, an example table is created and filled with mock order data.
CREATE TABLE if not exists expedited_orders(
order_id int,
order_date datetime,
key(order_id),
shard(order_id));
INSERT INTO expedited_orders VALUES(1, now());

/* Run this command until 524288 rows of data have been inserted into the table. */

INSERT INTO expedited_orders
SELECT order_id+(SELECT max(order_id) FROM expedited_orders), now()
FROM expedited_orders;
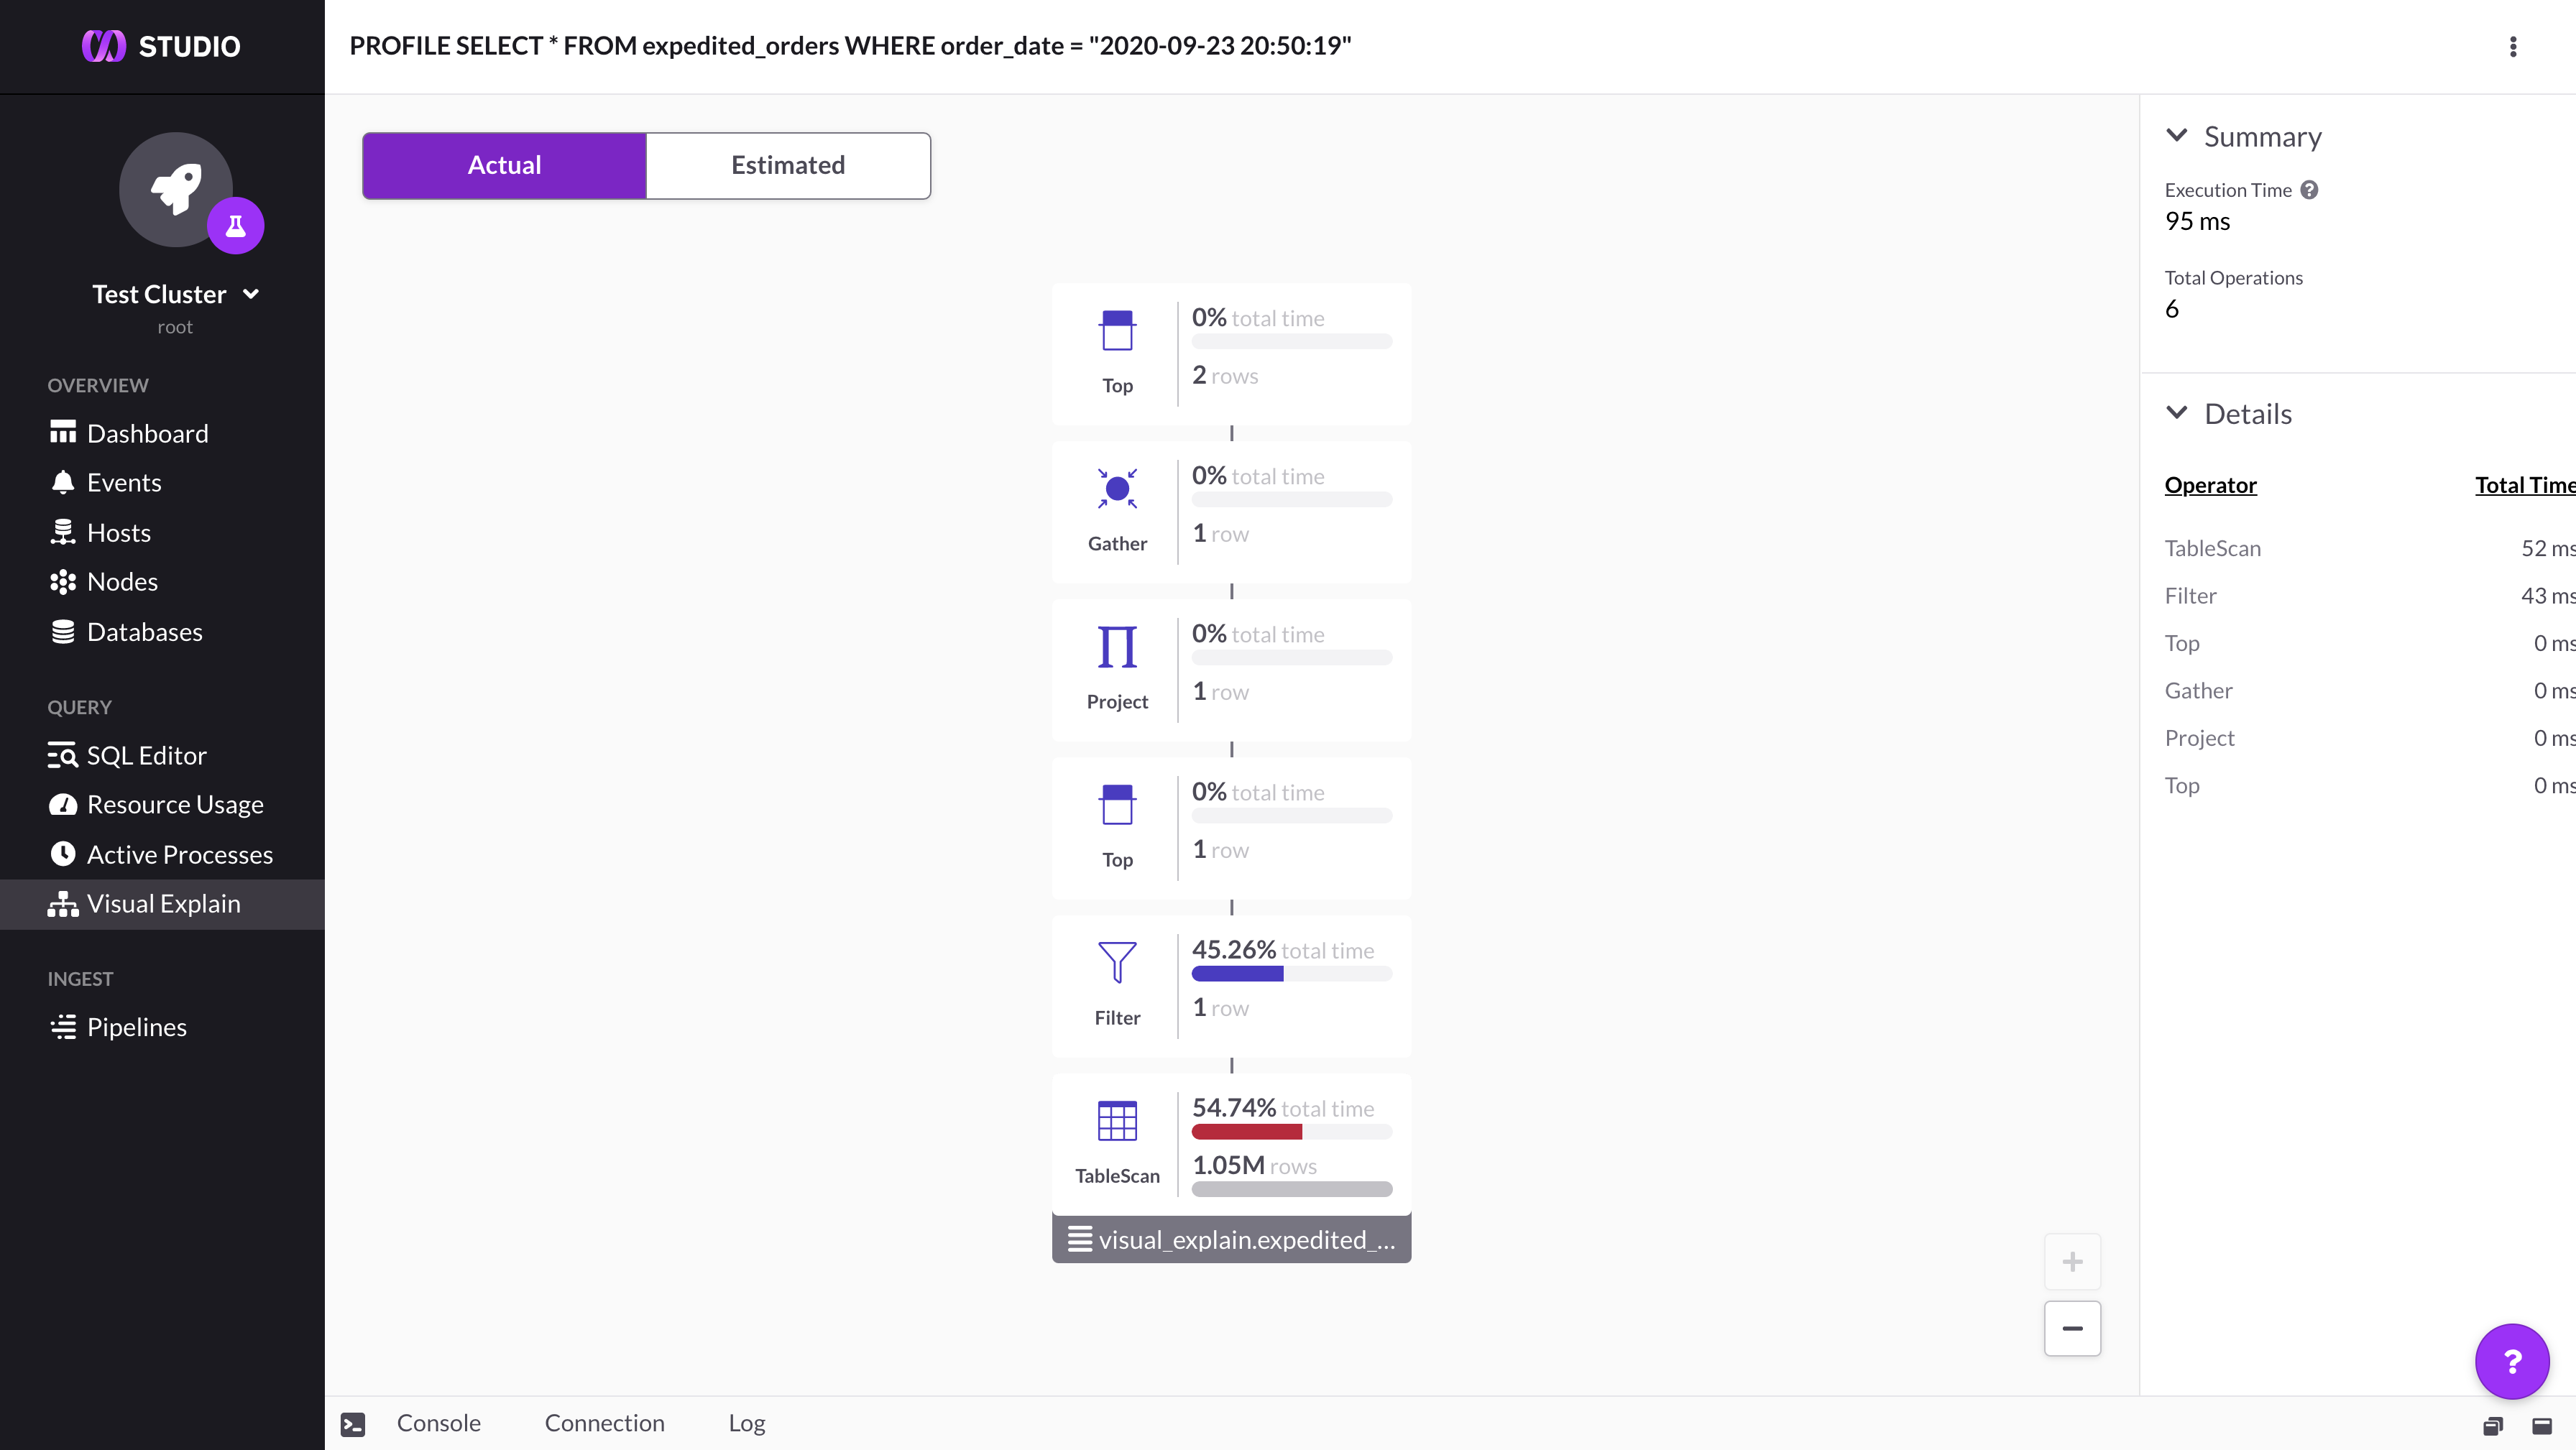
Running the below queries using Visual Profile reveals that SingleStore DB performs a full TableScan in this query plan. This means that each individual row is scanned in order to count those where the order_date is 2020-09-21 17:51:47.
/* Run this query to get an example order_date. */

SELECT order_date, count(*)
FROM expedited_orders
GROUP BY 1
HAVING count(*) = 1

/* Run this query using the order_date copied from from the previous query result,
in place of the date 2020-09-21 17:51:47. */

SELECT *
FROM expedited_orders
WHERE order_date = "2020-09-21 17:51:47";

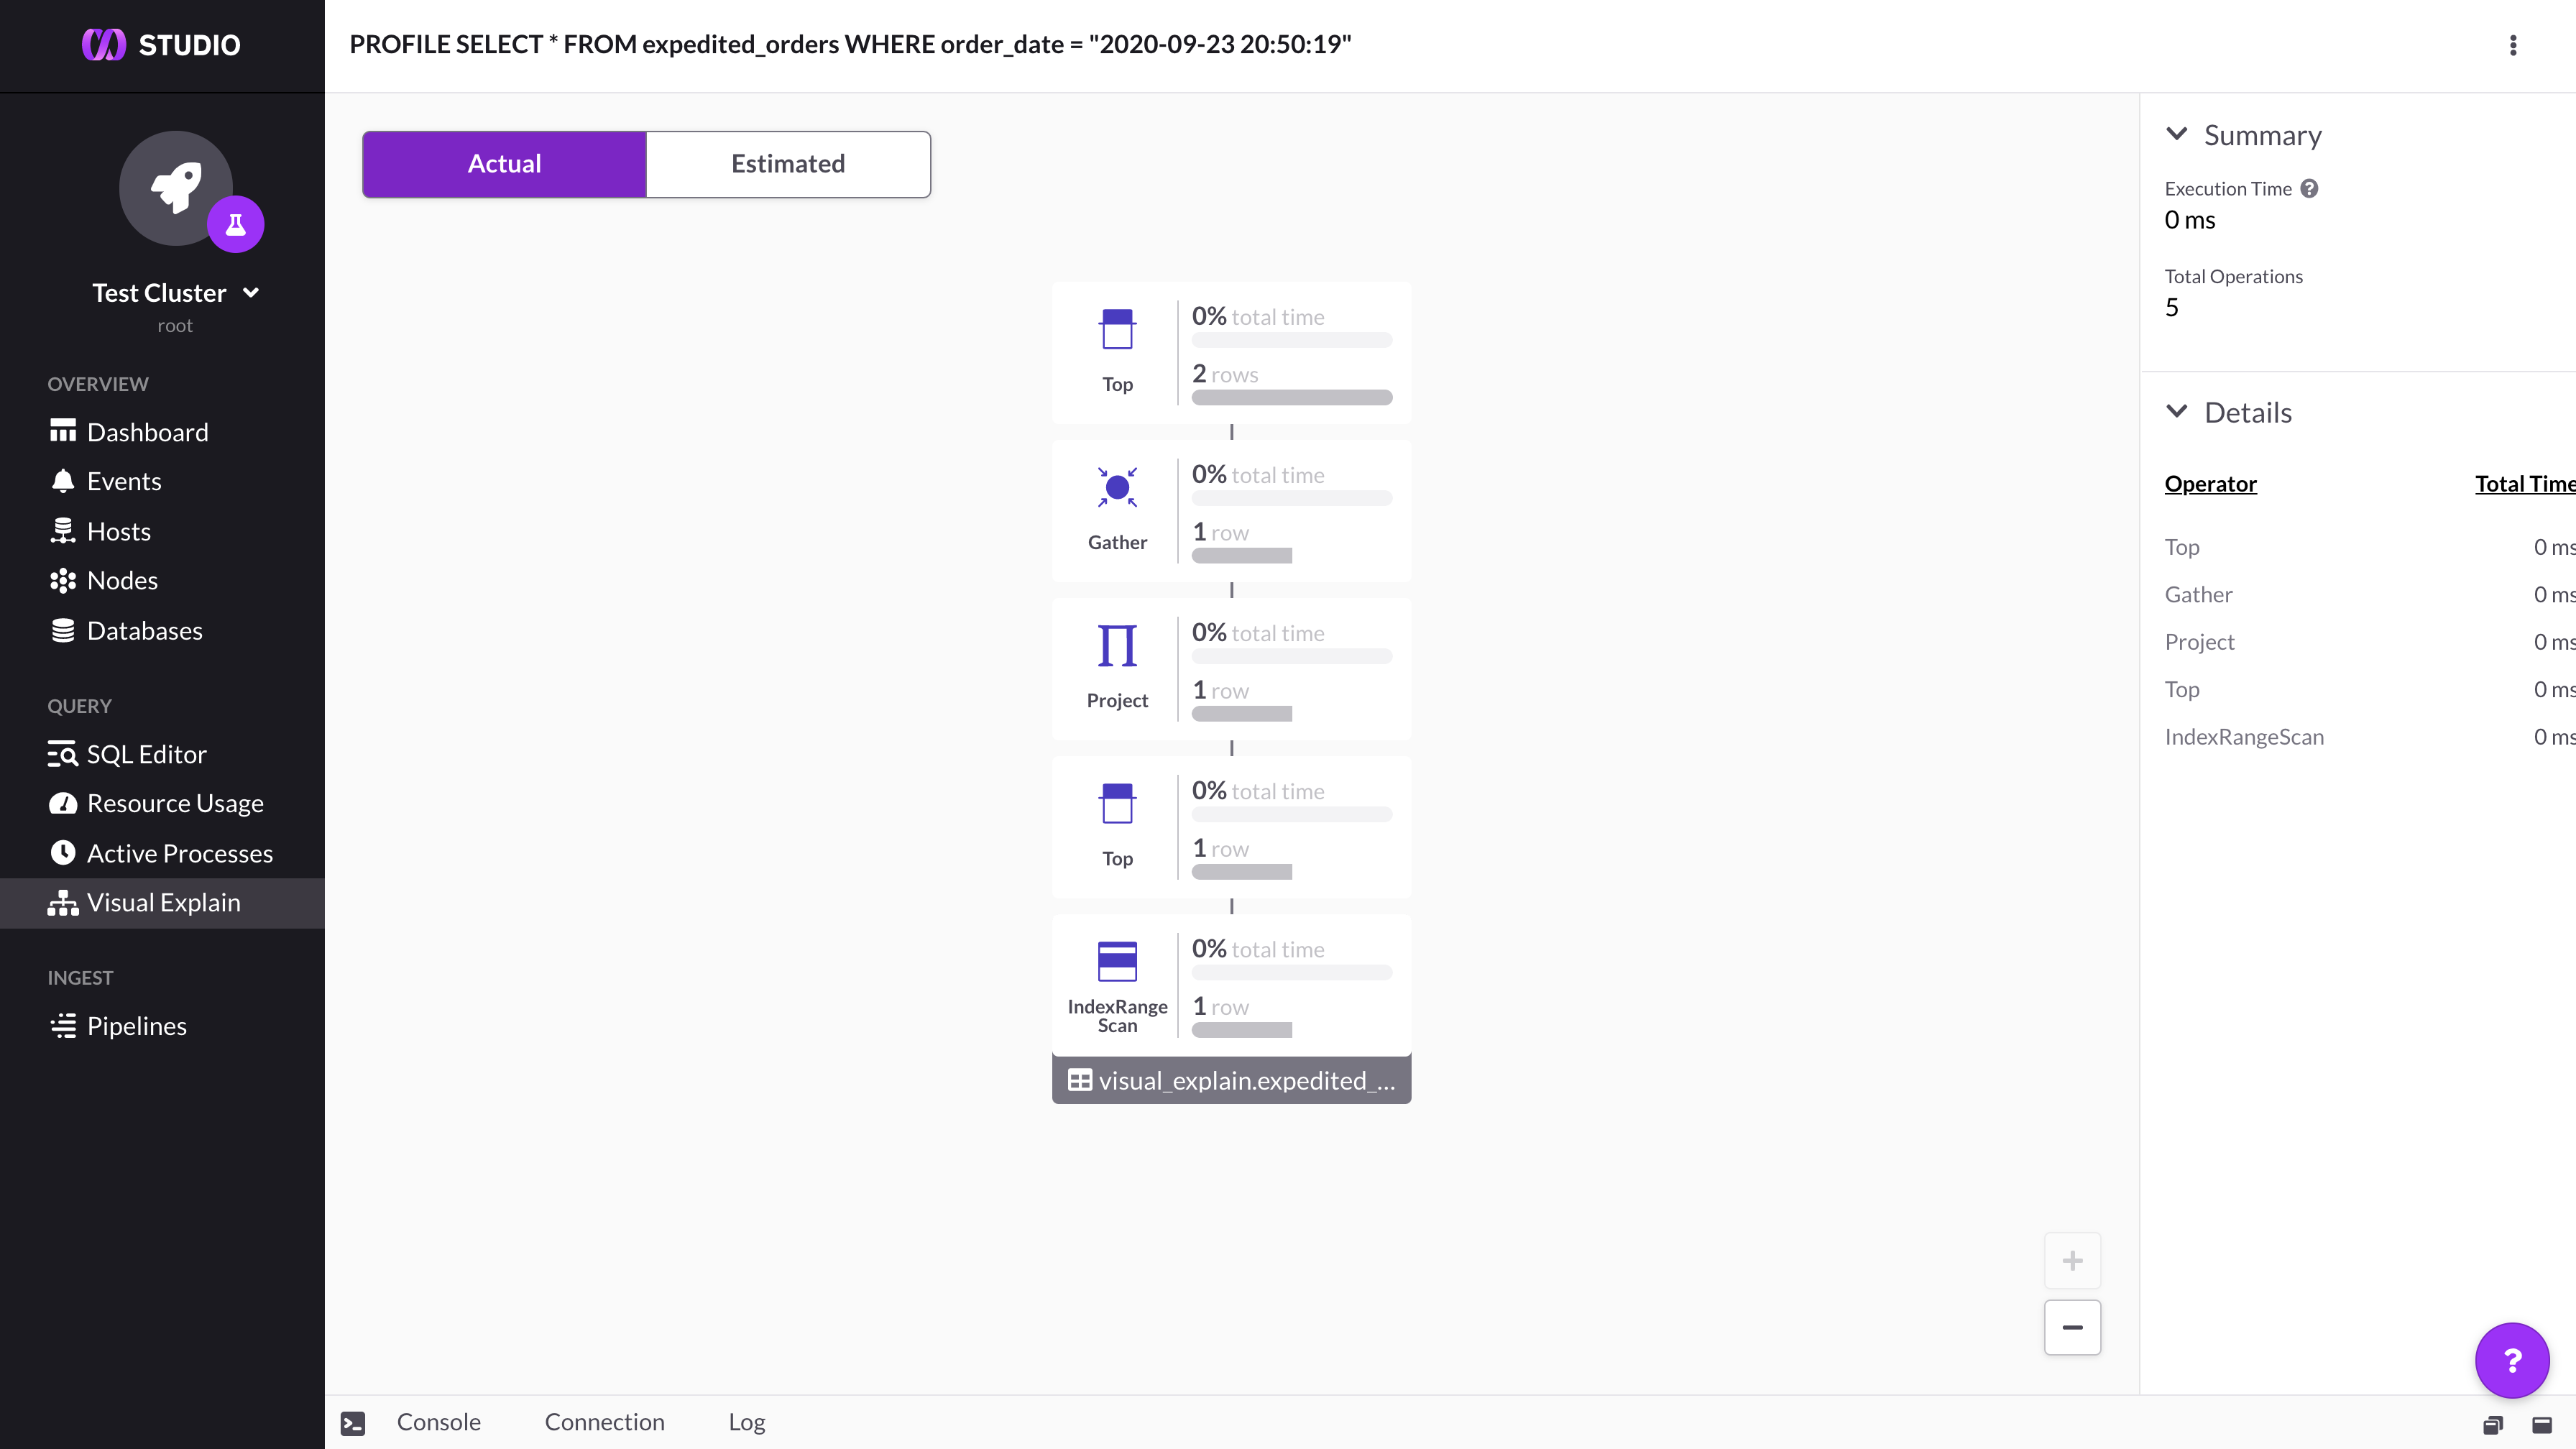
Adding an index on the order_date column, then running and profiling the same query again reveals an increase in performance. The runtime for the query decreases from 95 milliseconds to 1 millisecond. This is because the new index on order_date allows SingleStore DB to execute this query with IndexRangeScan instead of TableScan, meaning that the index is utilized in order to only scan rows which might contain the specified order_date.
CREATE INDEX date_index ON expedited_orders (order_date);

SELECT *
FROM expedited_orders
WHERE order_date = "2020-09-21 17:51:47";
DROP TABLE expedited_orders;

For more examples, see the final lab in the SingleStore Training course, Query Tuning.
Related Topics

