MemSQL has introduced a new monitoring solution with MemSQL 7.1.8. Refer to the introduction of Configure MemSQL’s Monitoring Solution for more information.
Similar to an airplane’s flight data recorder, MemSQL’s historical monitoring feature is designed to capture and reveal MemSQL cluster events over time.
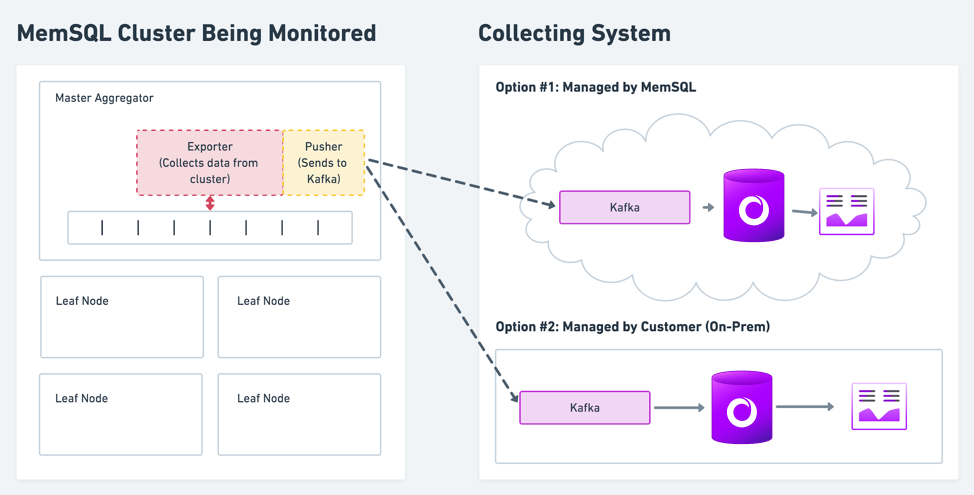
The MemSQL monitored cluster pushes event data to the MemSQL collecting cluster where it is collected and stored. When these event data are then analyzed through the associated Grafana dashboards, trends can be identified and, if necessary, actions taken to remediate issues.
Historical Monitoring High-Level Architecture
Provided dashboards include:
- Active session history: Aggregated resource consumption by activity and activity type
- Activity history: Historical resource consumption by a specific activity
- Detailed cluster view: A “birds-eye view” of a single MemSQL cluster
- Information schema view: Provides a view into
information_schemaviewsPROCESSLIST,TABLES, andTABLE_STATISTICS - Memory usage: Granular breakdown of memory use for a host
- MemSQL status and variables view: Collected status variables from each host in the cluster
- Node breakout: System metrics from each host in the cluster
- Node drilldown: System metrics from each host in the cluster, with the ability to focus on a specific metric subsystem
Prerequisites
These instructions have been developed for MemSQL clusters that have been installed via .rpm or .deb packages as a sudo user.
-
A MemSQL 6.8.7 or later cluster to monitor (the monitored cluster)
-
A MemSQL 6.8.7 or later cluster to collect monitoring data (the collecting cluster). While this can be the same as the monitored cluster, a separate cluster is recommended so as not to impact the performance or resource usage of the monitored cluster. Recommended: A MemSQL cluster with two aggregator nodes and two leaf nodes, each with two terabyte (TB) disks, with high availability (HA) enabled.
-
An Apache Kafka 1.1.0 or later cluster with the ability to create two new topics and with brokers configured so that they are accessible by both the monitored and collecting clusters
-
A Grafana 6.0.0 or later instance that can access the collecting cluster
Port Configuration
| Default Port | Used by | Invoked by |
|---|---|---|
2181 |
Apache Zookeeper | Apache Kafka |
3000 |
Grafana | User browser |
3306 |
MemSQL | memsql_exporter |
8080 |
MemSQL Studio | User browser |
9092 |
Apache Kafka | memsql_pusher |
9104 |
memsql_exporter |
memsql_pusher(Prometheus if used) |

